The price of gasoline declined by 1.8 cents per gallon in Wyoming on Tuesday to average $4.29 per gallon.
The website GasBuddy.com, which tracks national gas prices, reported Wyoming’s average gas price was up 3.5 cents per gallon from one week ago, and was up $1.28 per gallon from one year ago.
Wyoming’s average price for gasoline remained below the national average of $4.59 for a gallon of regular, unchanged from Monday.
High and Low Prices:
The highest gasoline price in Wyoming on Tuesday was in Jackson at $5.18 per gallon. The lowest surveyed price was $3.98 per gallon at the Maverik station at 1301 Third St. in Laramie.
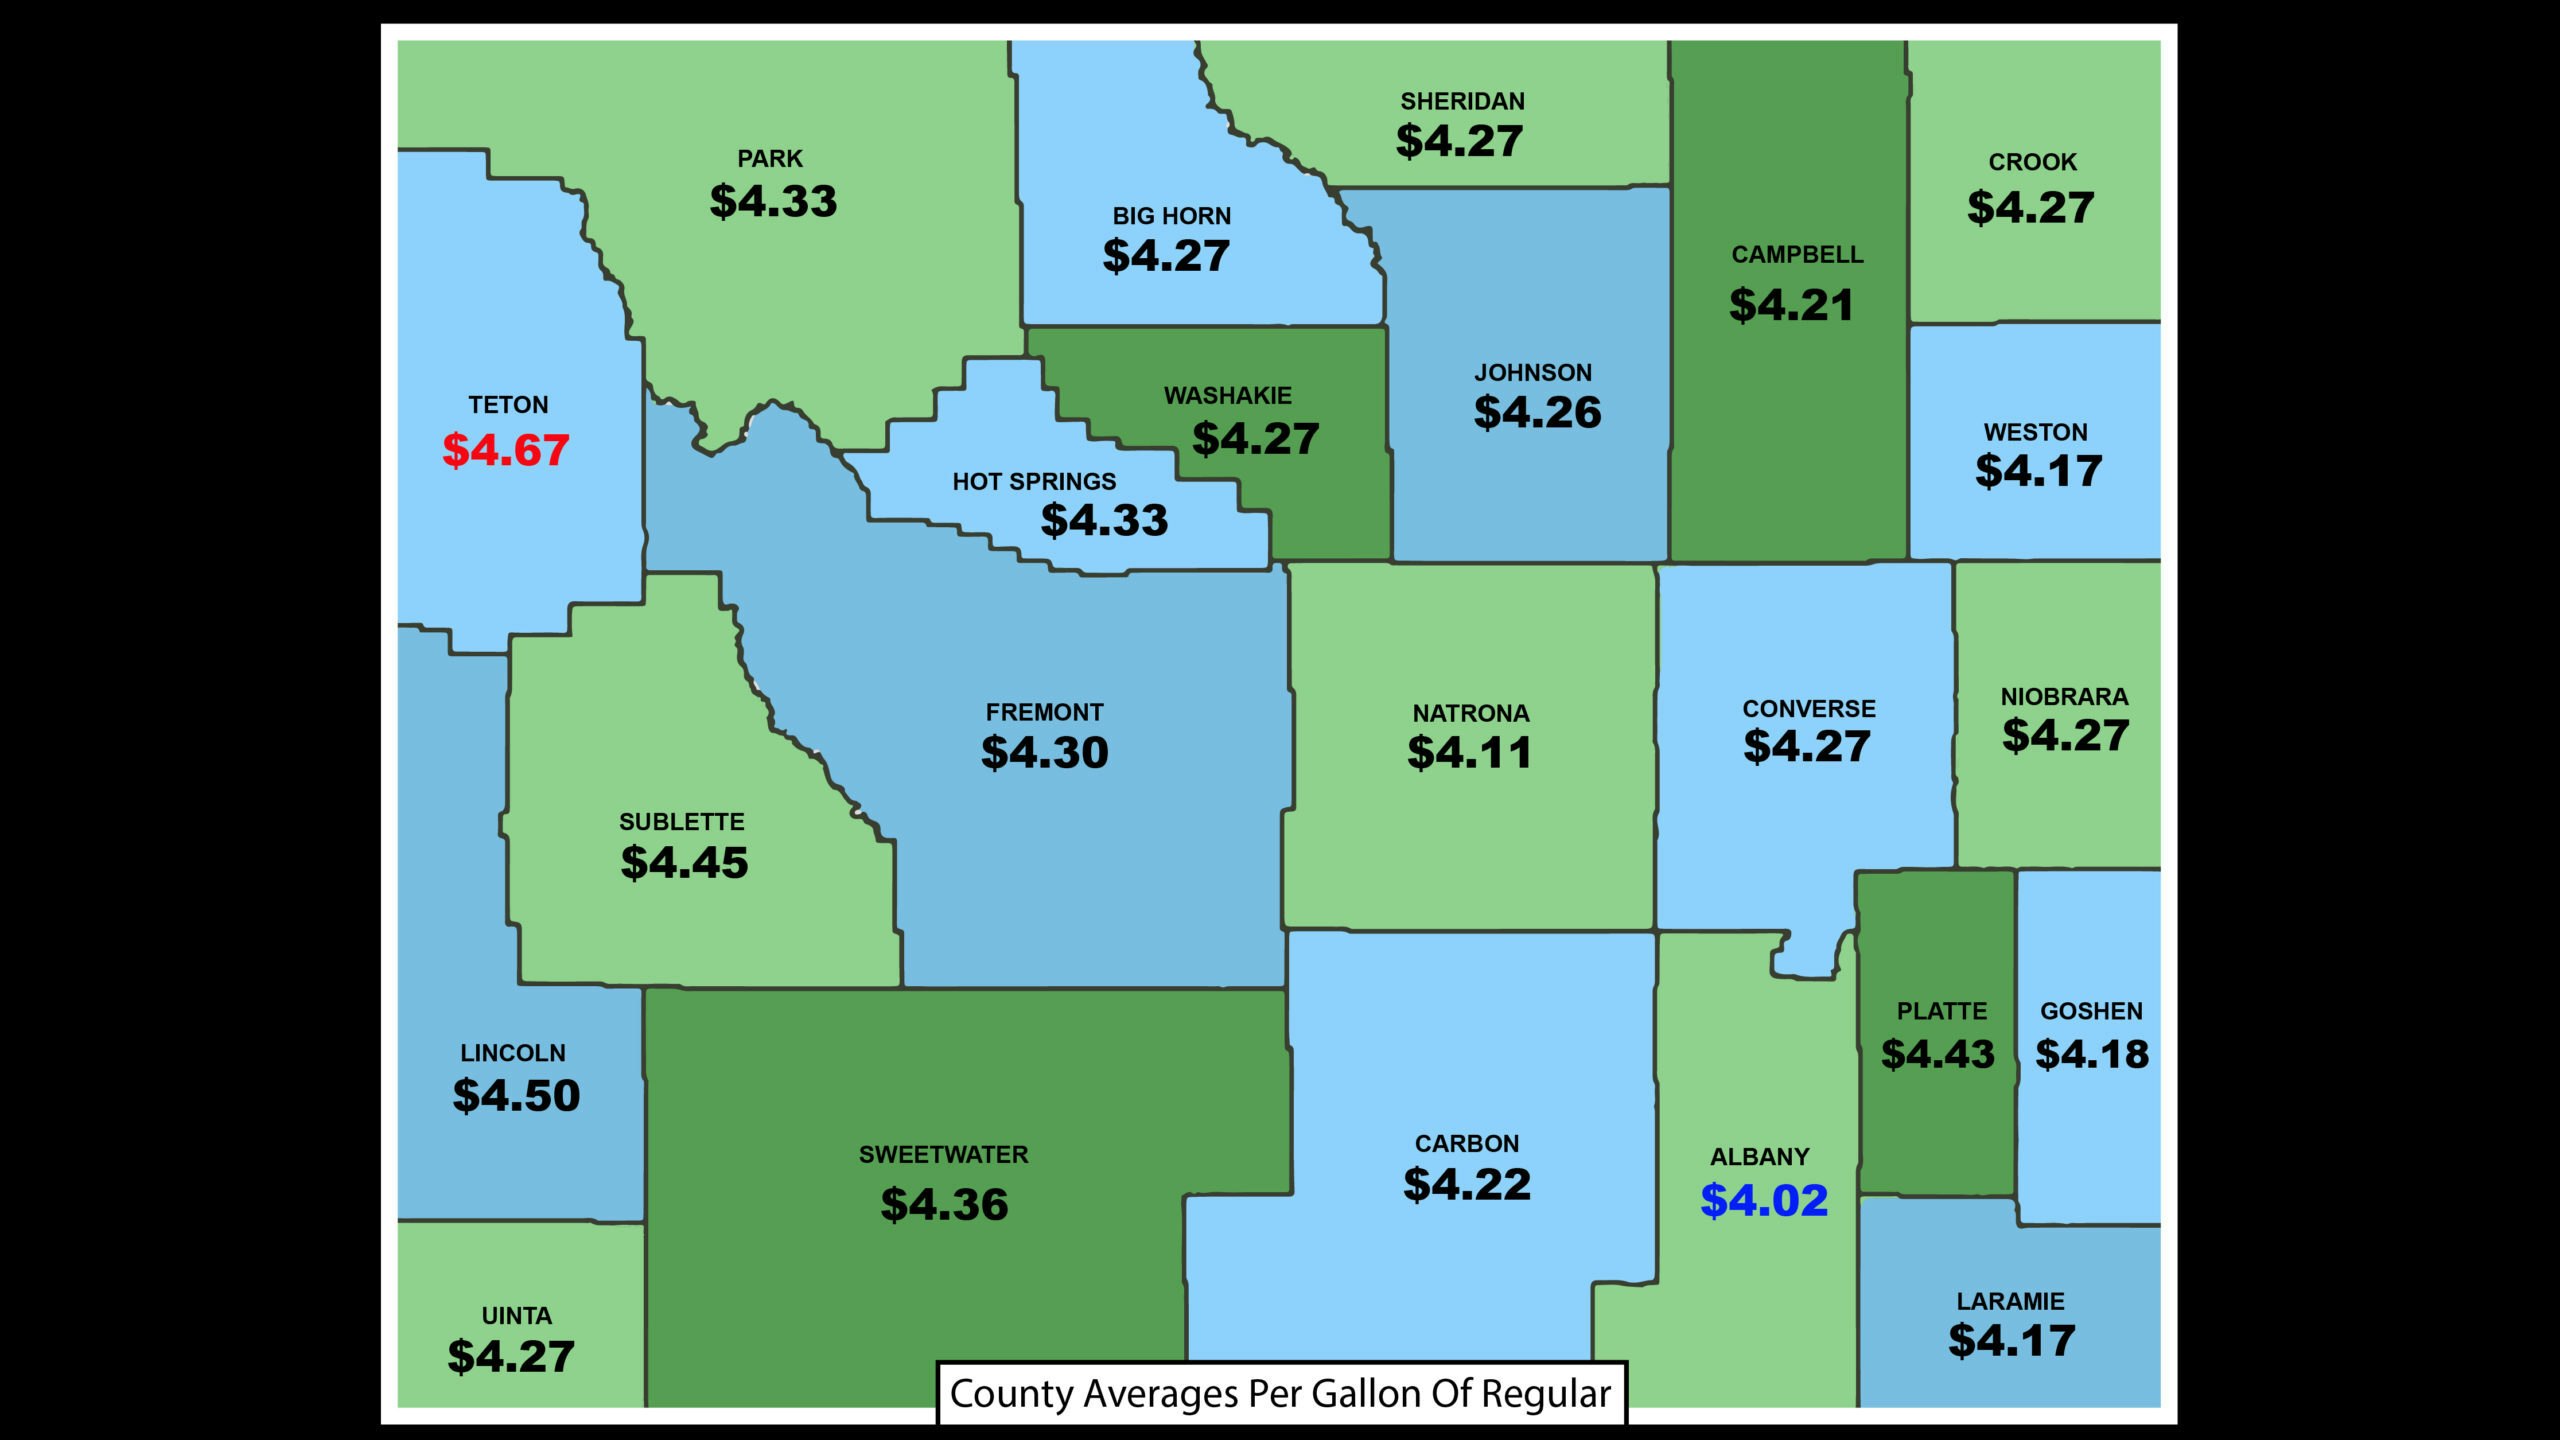
The county with the highest average price was Teton at $4.67 per gallon. The county with the lowest average was Albany at $4.02.
These are the highest and lowest reported prices among those stationed surveyed.
Tuesday’s Big Movers:
Lincoln County was up 29 cents; Sublette County was up 17 cents; Platte County was up 13 cents; Goshen County was up 7 cents, and Hot Springs was up 6 cents.
*The average price per gallon of regular in each Wyoming county:
Albany $4.02; Big Horn $4.27; Campbell $4.21; Carbon $4.22; Converse $4.27; Crook $4.27; Fremont $4.30; Goshen $4.18; Hot Springs $4.33; Johnson $4.26; Laramie $4.17; Lincoln $4.50; Natrona $4.11; Niobrara $4.27; Park $4.33; Platte $4.43; Sheridan $4.27; Sublette $4.45; Sweetwater $4.36; Teton $4.67; Uinta $4.27; Washakie $4.27; Weston: $4.17.
Most Common County Average:
$4.27 per gallon, with seven counties reporting this price.
*The lowest price per gallon, reported in major Wyoming cities:
Basin $4.29; Buffalo $4.19; Casper $3.99; Cheyenne $3.99; Cody $4.29; Douglas $4.12; Evanston $4.38; Gillette $4.11; Jackson $4.48; Kemmerer $4.33; Laramie $3.98; Lusk $4.19; Newcastle $4.12; Pinedale $4.42; Rawlins $4.09; Riverton $4.22; Rock Springs $4.29; Sheridan $4.17; Sundance $4.24; Thermopolis $4.29; Wheatland $4.08; Worland $4.27.
Tim’s Observations:
Sometimes it’s hard to put into perspective just how wild the oil futures market is. Why was gas so cheap a couple of year ago, and why is it so high now? Politics aside, and just looking at oil prices, you can easily understand where we were, where we are, and likely where we are heading.
This graphic from the Energy Information Administration’s (EIA) shows oil prices steadily climbing since their all time low of $-37.63 per barrel of oil. Yes, that’s a negative selling price. I’m still not sure how that works except that when prices were negative, that would theoretically mean that if you were trying to sell a barrel of oil, you would have to pay a buyer $37.63.
This is in part because of the way in which oil is traded. At the time this occurred, the world’s supply was maxed out and nobody wanted the oil because there was no place to put it.
Sounds crazy but it’s simple supply and demand. There was no demand, yet the oil taps couldn’t just be turned off.
As of Tuesday, Brent oil prices were $113.39 per barrel. From the record low of $-37.63, to today’s price, is a rise of $150.03.

Want to help us gather the most accurate gas prices for this report? Consider downloading the GasBuddy app and submit the gas prices in your area.
*Note: Prices in this report are for reference only. They are gathered just prior to posting, and may not reflect prices that have changed since last posted.


