On Tuesday the price of gasoline fell by 1.4 cents per gallon over the previous 24 hours to average $4.02.
The website GasBuddy.com, which tracks national gas prices, reported Wyoming’s average gas price is down 2.8 cents per gallon from one week ago and is up $1.14 per gallon from one year ago.
Wyoming’s average price for gasoline remained below the national average of $4.083 for a gallon of regular.
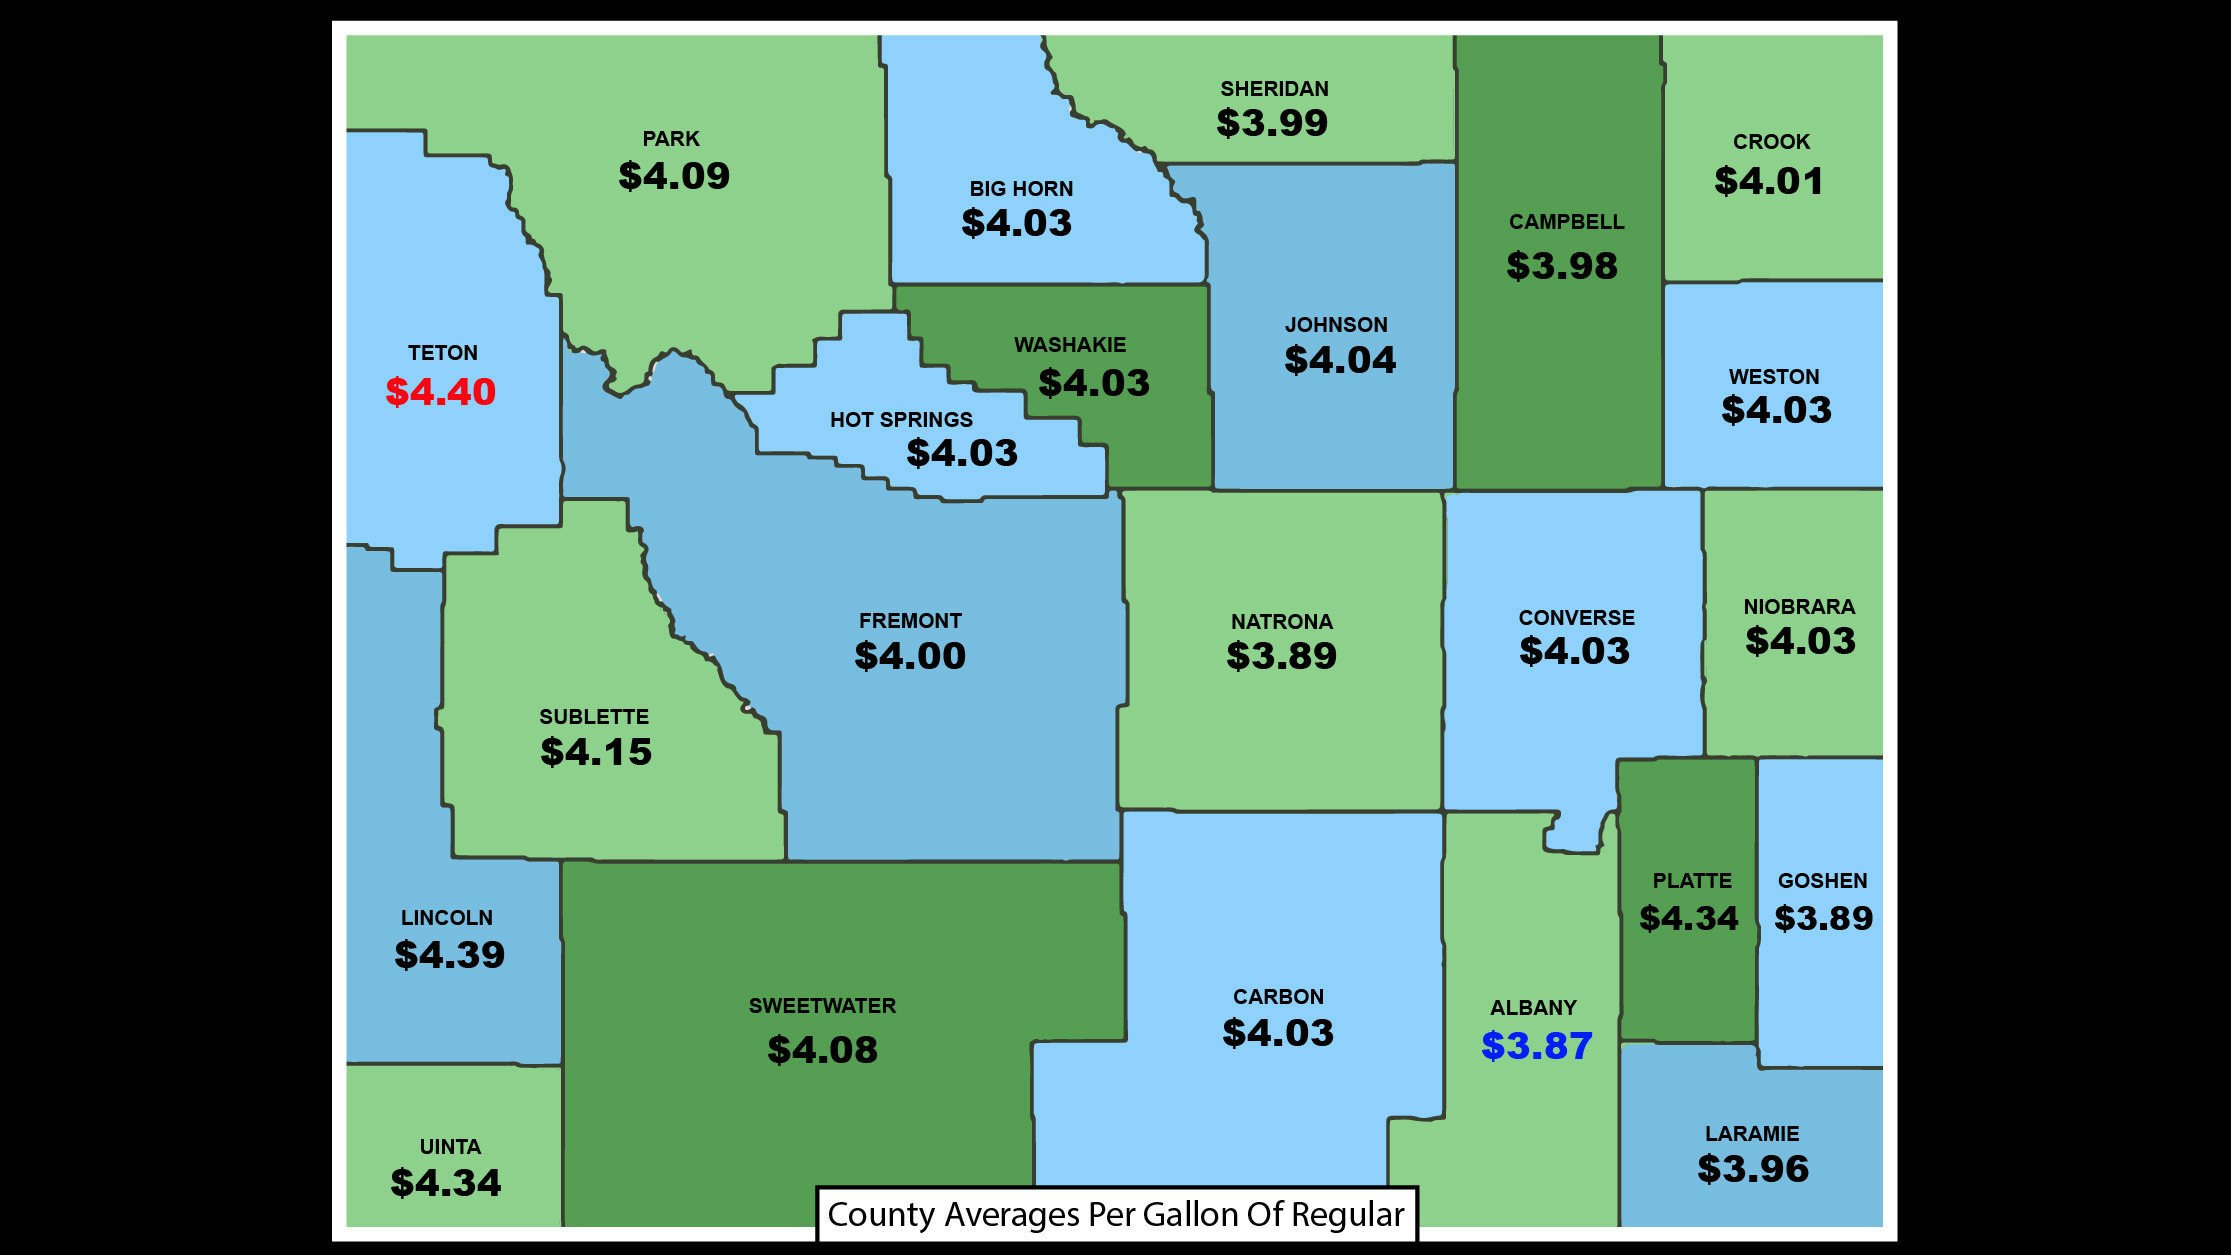
*The average price per gallon of regular in each Wyoming county:
Albany $3.87; Big Horn $4.03; Campbell $3.98; Carbon $4.03; Converse $4.03; Crook $4.01; Fremont $4.00; Goshen $3.89; Hot Springs $4.03; Johnson $4.04; Laramie $3.96; Lincoln $4.39; Natrona $3.89; Niobrara $4.03; Park $4.09; Platte $4.34; Sheridan $3.99; Sweetwater $4.08; Sublette $4.15; Teton $4.40; Uinta $4.34; Washakie $4.03; Weston: $4.03
The big movers Tuesday were Platte County, up 35 cents per gallon, and Uinta County, up 33 cents.
*The lowest price per gallon, reported in major Wyoming cities:
Basin $4.15; Buffalo $3.95; Casper $3.85; Cheyenne $3.93; Cody $4.10; Douglas $3.78; Evanston $4.25; Gillette $3.81; Jackson $4.37; Kemmerer $4.28; Laramie $3.79; Lusk $4.19; New Castle $3.88; Pinedale $4.14; Rawlins $3.99; Riverton $3.99; Rock Springs $3.99; Sheridan $3.94; Sundance $3.97; Thermopolis $3.97; Wheatland $3.88; Worland $4.07.
Tim’s Observations:
Where does Wyoming sit in the hierarchy of U.S. oil producing states? Just how much impact does our production impact the jump at the pump? Let’s look at the top seven oil producing states.
- Texas
Total barrels annually (2020): 1.78 billion
Share of U.S. production (2020): 43.02%
Barrels per month (November 2021): 150.12 million - North Dakota
Total barrels annually (2020): 434.89 million
Share of U.S. production (2020): 10.53%
Barrels per month (November 2021): 34.59 million - New Mexico
Total barrels annually (2020): 370.40 million
Share of U.S. production (2020): 8.97%
Barrels per month (November 2021): 42.69 million - Oklahoma
Total barrels annually (2020): 171.74 million
Share of U.S. production (2020): 4.16%
Barrels per month (November 2021): 11.84 million - Colorado
Total barrels annually (2020): 167.83 million
Share of U.S. production (2020): 4.06%
Barrels per month (November 2021): 12.24 million - Alaska
Total barrels annually (2020): 163.85 million
Share of U.S. production (2020): 3.97%
Barrels per month (November 2021): 13.38 million - Wyoming
Total barrels annually (2020): 89.04 million
Share of U.S. production (2020): 2.16%
Barrels per month (November 2021): 8.79 million
Wyoming might be seventh in the nation for oil production, but the difference between fourth place and seventh is a mere 3.05 million barrels per month. Can we to better? I’m sure we can!
*Note: Prices in this report are for reference only. They are gathered just prior to posting, and may not reflect prices that have changed since last posted.